Using AI to measure and manage Diversity
We had our AI analyze Trump Cabinet, Obama Cabinet, and Top 500 US investors and this is what we found.
Average Trump cabinet member, average Obama cabinet member and average Top 100 US investor
I have been thinking about the topic of leveraging AI to benefit diversity for many months now. So this is my attempt at one of the ideas.
Before I get into it I should provide a little context. I have been a borderline activist when it comes to promoting human equality. When I don’t see things balanced it bothers me so I have been trying in my own way to make things right. I built a diverse tech team at HBO with 40% female and staff from 12 countries, I ran corporate diversity groups, I helped Miami-Dade public schools STEM advisory board as their chairman and I built a startup with a diverse set of co-founders.
People like me who are fighting against race, gender and age inequality are banging their heads against the wall on a daily basis. Because the progress is far too slow to reflect true diversity.
As I am running a Machine Learning based startup I see many opportunities for AI to help in measuring and managing diversity at scale and increase the pace. I envision leveraging AI in two ways:
Using AI to measure and analyze images, video, text and audio for bias.
Using AI to audit other AI for bias. It is now common knowledge that AI can become biased faster than humans if it learns from biased data.
For this particular post, I want to focus on #1 and I will share some thoughts on #2 in the future. We took examples that are glaringly obvious at the moment just to prove the point of using this method.
For this study, we used computer vision and deep learning to analyze images of people in the below groups for race, gender and age composition
- Trump Cabinet members
- Obama cabinet members
- Top 100 US tech investors
and compared it with the US demographics as a benchmark.
You can access the dataset here.
Some people might find this analysis controversial. Before you get too uneasy, I want you to know that what I am proposing is an analysis of a group for measuring diversity. By the way, Facebook and Google already have your individual data.
The process
- Gather the pictures of the Trump, Obama, and Top US investors. *
- Run the pictures through the face averager to get a single average photo for each group. **
- Analyze the pictures using RefineAI models for Age and Gender. ***
- Analyze the pictures for Race using the API from Kairos. ****
- Collect all the data, analyze against US demographics and tabulate.
Why AI for analyzing data for diversity.
- AI is impartial. (If trained with a diverse dataset)
- We can scale the assessment fast. Assess large sets of data faster than humans can.
- Low cost: The cost of running the AI models are very low.
Example #1: Trump cabinet vs Obama cabinet

Left: Average face of a Trump Cabinet member. Right: Average face of a Obama cabinet member
The results of the face averager were not surprising in some ways. The average Trump’s cabinet member is caucasian, male and older. Whereas the average Obama’s cabinet member is caucasian but more feminine and a little younger.
Gender
The AI was accurate and found that the Trump administration is predominantly male. No surprise there. The Obama cabinet has a little better gender ratio. But both are off the mark compared to the US labor demographics.
A thought I had here was that this could be a weighted analysis based on their order of influence. The women in Trump’s cabinet have lower influence than the women in the Obama administration (example: Hillary Clinton).

Race
The AI found that the Trump Administration is 87% white with no Latino and one Black. The Obama Administration was also majority white with no Asians. AI identified Cuban cabinet member Alexander Acosta as Caucasian. Further training with relevant dataset could help increase the accuracy.

Age
The AI predicted lower age by an average of 6 years across both the Trump and Obama cabinet members. The real median age of a Trump cabinet member is 62 and for Obama it is 58. This may be because their public pictures are from a few years ago. We found that the Microsoft and Amazon algorithms also got them wrong. Since they are consistently lower, the difference between the two datasets is still relevant.

Example #2: Top 100 US tech investors

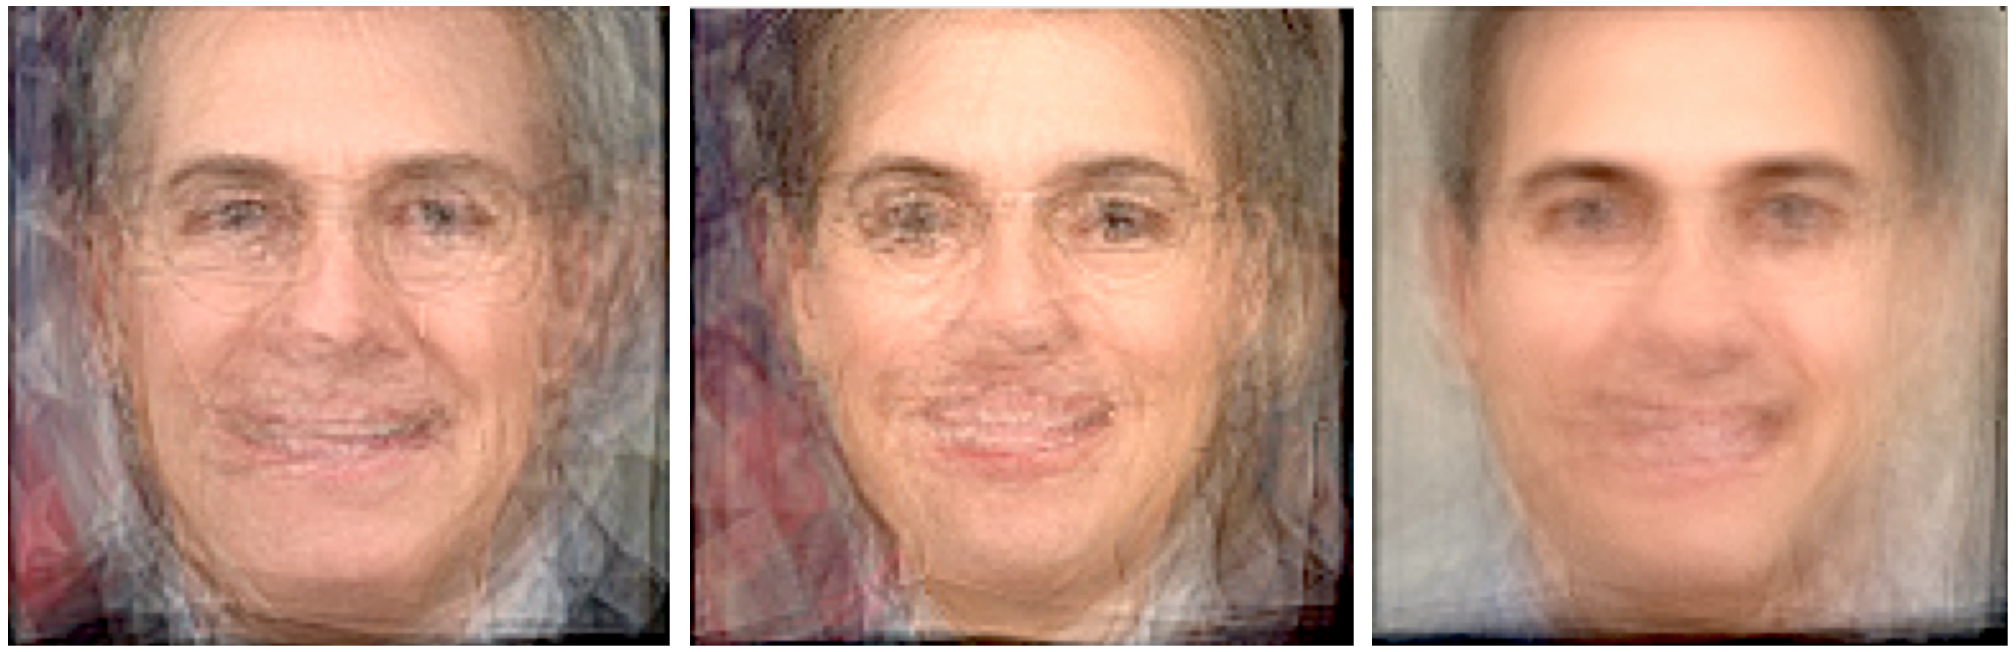
Average Top 100 US tech investor
In case you were wondering what an average top US tech investor looks like. As my wife said he looks Latino. The ironic part is the number of Latinos in that list is a whopping 0%. So this Latino looking guy here is a combination of Caucasian and Asian. For this analysis, we used the Forbes Midas list for top VCs (https://www.forbes.com/midas/list/). There were 2 pictures that the algorithm couldn’t analyze so the analysis was on 98 in the list. Below are the details around the Gender, Race and Age analysis:
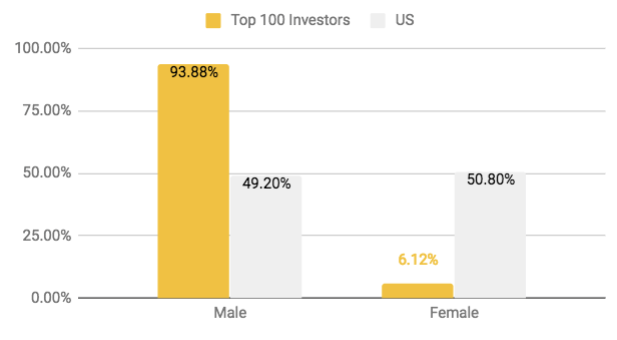
Gender
The AI found 92 men and 6 women. Relative to the US demographic this is a staggering ratio. No wonder great female startup CEOs have trouble raising money for their startups. According to PitchBook, only 2.2% of all VC funds went to solely women-owned companies in the US.
Race
The AI found that the 78% of them were White and 21% Asian. With Blacks and Latinos completely missing.

Age
The median age of a Top investor according to the AI is 42 which is on par with the US labor statistics. Their real age might be a little higher since their public photos may be from a few years ago. We may have to add a constant to make up for this difference.

Limitations
The AI algorithms are only as good as the training dataset. So there needs to be further training for age and race to improve the accuracy. It goes without saying that the dataset has to be diverse.
This is a small experiment to showcase how with the help of Machine Learning we can measure and analyze data for diversity.
A lot more work is required for automating this, applying this to large data and for practical use cases.
I am only showcasing the analysis in the US in these examples. Most large companies are global. The analysis should be subjective based on the country.
Potential applications and advancements
Analysis of the diversity of
Government organizations — congress, state governments, counties, etc.
Media outlets. I would love to compare CNN vs Fox News vs MSNBC.
Executive management and boards of corporations and hiring practices. We don’t need to wait for a diversity disclosure from the companies.
Automating the gathering of images from public sources (eg. Google image search, Glassdoor, Linkedin, Wikipedia).
Automating the analysis and reporting so we can view the trend over time as people leave organizations or join organizations. Uber will be a great case study to track the trend as it is being reorganized to improve diversity.
This analysis is only for images. But similar analysis is possible with videos to understand the diversity in ads and movies. An example from Google.org: https://www.google.com/about/main/gender-equality-films/
“Seeing is Believing”
Us humans need to see something before we can accept that it really exists or occurs. So one of the first steps in improving diversity is to be able to measure the gap. We can leverage AI to measure the gaps at scale and track them over time.
I would love to hear your thoughts and comments on this and other methods of improving diversity.
References and acknowledgments:
- https://en.wikipedia.org/wiki/Cabinet_of_Donald_Trump *
- https://en.wikipedia.org/wiki/Confirmations_of_Barack_Obama%27s_Cabinet *
- https://www.forbes.com/midas/list/#tab:overall *
- Cornell study on exposing diversity: https://arxiv.org/abs/1707.02353
- The face averager was built by RefineAI.com. Thank you, Rafi!**
- The models for the face recognition, age and gender detection were built by RefineAI.com. Thank you again, Rafi!***
- The model for race classifier is from Kairos.com. ****
- US demographics (Age): https://www.census.gov/prod/cen2010/briefs/c2010br-03.pdf
- US demographics (Race): https://en.wikipedia.org/wiki/Historical_racial_and_ethnic_demographics_of_the_United_States
- US demographics (Age): https://www.usnews.com/news/articles/2015-12-24/older-workers-to-dominate-labor-market-by-2024